#60 🎯 Data completion in Qlik Sense
🎯 Keep your Data accurate. 🔎 Building a data completion Dashboard in Qlik
You know that Context is such powerful when designing an analytical solution, right?
Sometimes, you can add value to your data by bringing new ones from outside your organization.
It could be public or produced by a third-party provider.
There are tons of opportunities for you to improve your solutions this way.
Since you don't manage those data sources, you have to make sure they're accurate.
It happens that Data is missing for some dimensions values.
That's why you need to 👇
Inform users that some Data is missing
Help find errors
Facilitate analysis over a complete perimeter
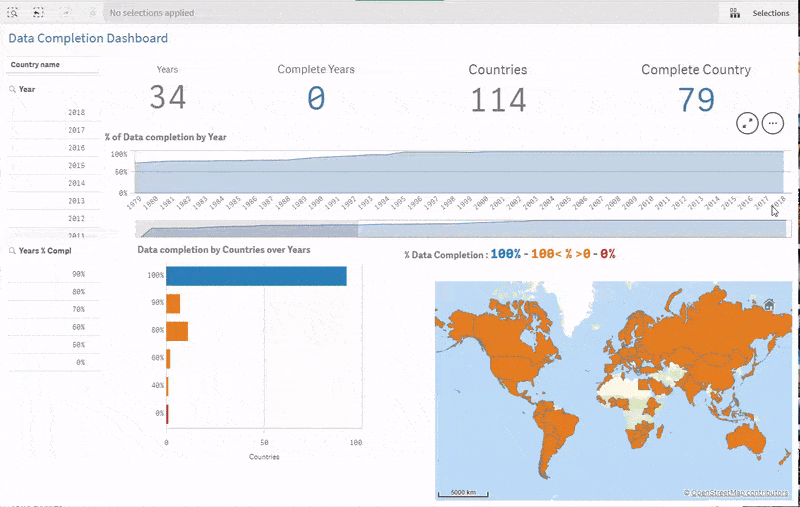
In my example, I'm working with Gross National Income (GNI) for a Qlik Sense app to be published at Dataonthe Earth
And quite many countries and Years are not complete.
The trick is to compare your fact-value number with your dimension values. 🧙♂️
Do you often use external data?
⁉How to ⁉
Let's apply it to Countries and start with the most straightforward expression :
Count(GNI) / Count(Distinct Year)
Use this one for a bar Chart with Country as a dimension.
To build a KPI, aggregate the results :
sum(if(
aggr(Count(GNI)/Count(Distinct Year),[Country name])
=1,1,0))
Cheers